Is SPCX Stock Ready for a Comeback? Deep Technical Analysis, Buy Recommendation & Price Targets
Technical Research Report | Space Exploration Technologies Corp. (SPCX) — Research by Sahil Goyal | US Stock Market
1. Introduction: Is SPCX Stock Ready for a Comeback?
After correcting nearly 40–45% from its previous highs, Space Exploration Technologies Corp. (SPCX) has finally entered a price zone where technical analysts are beginning to notice early buying interest.
The biggest question among traders is: Has SPCX completed its correction, or is more downside still possible?
Our technical study suggests that the current price action deserves close attention. Although confirmation is still required, the stock is gradually showing signs of accumulation near an important demand zone. This report is based entirely on technical analysis, including price action, support and resistance, market structure, trend analysis, and risk-reward evaluation.
2. Current Market Structure
The stock has remained under pressure for several weeks after witnessing heavy profit booking from higher levels.
However, recent trading sessions indicate an important shift. Instead of aggressive selling, the stock has started consolidating near support while buyers are slowly returning. This transition often becomes the first stage of a potential trend reversal.
3. Why SPCX Is Becoming Interesting
Professional traders rarely buy stocks after huge rallies. Instead, they look for stocks that have corrected significantly but continue to hold strong technical support. SPCX currently meets several of these conditions.
Price trading near a major demand zone.
Selling pressure has reduced considerably.
Buyers are gradually defending lower levels.
Favorable risk-to-reward compared with previous months.
4. Technical Analysis
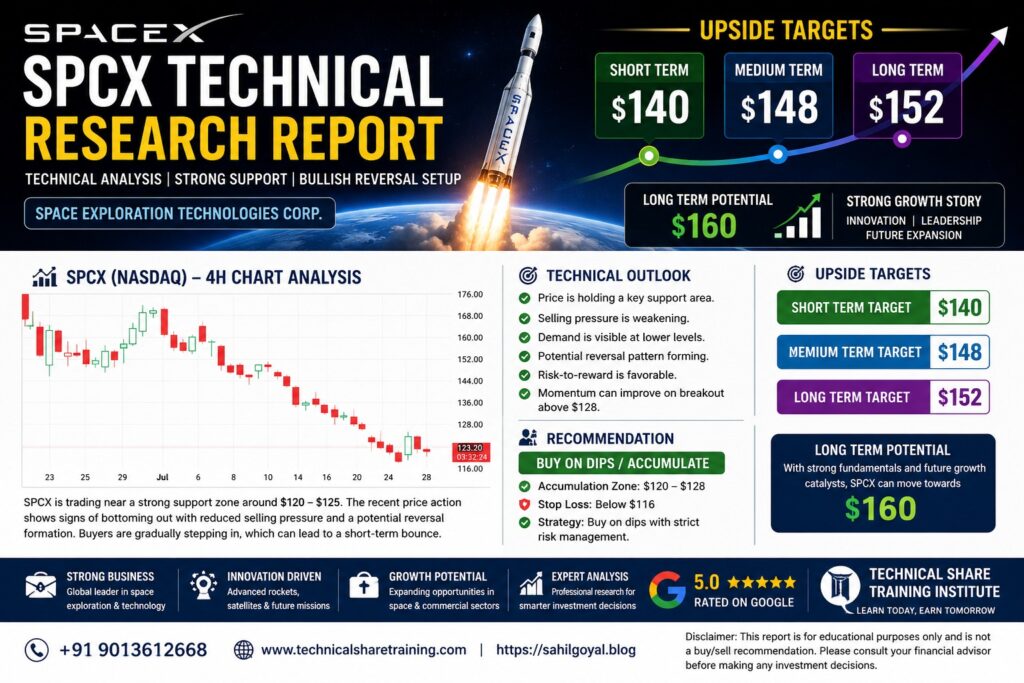
From a price-action perspective, SPCX is attempting to establish a base. The chart shows:
- Strong support between $120–125
- Lower selling momentum on recent declines
- Improving demand candles
- Buyers absorbing selling pressure
- Early bullish structure developing
The stock is not yet in a confirmed uptrend, but it is clearly stronger than it was during the recent decline. If buying volume continues to improve, a technical breakout may follow.
5. Why We Are Bullish
Our positive technical outlook is based on several core factors:
- 1. Strong Demand Zone: The current support area has attracted buying interest multiple times.
- 2. Reduced Selling Pressure: Large bearish candles have become smaller, indicating weakening momentum from sellers.
- 3. Attractive Risk-to-Reward: Buying near support generally provides a better trading opportunity than chasing higher prices.
- 4. Technical Stabilization: Price has started moving sideways instead of making fresh aggressive lows.
- 5. Possible Trend Reversal: If resistance levels are crossed with good volume, SPCX could enter a new bullish phase.
6. Technical Buy Recommendation
Current levels appear suitable for gradual accumulation rather than aggressive buying. Professional traders may consider building positions in phases while following proper risk management.
7. Technical Price Targets
The first major resistance where partial profit booking can be considered.
A breakout above $140 could open the path toward this level.
Sustained bullish momentum may push the stock toward this technical objective.
If broader market sentiment remains supportive and SPCX confirms a bullish reversal, the stock may gradually move toward the $160 zone over the longer term.
8. Suggested Trading Strategy
Entry Zone: $120–130
- Buy gradually instead of investing all capital at one level.
- Review price action regularly.
- Maintain disciplined risk management.
- Avoid emotional trading decisions.
- Focus on confirmation rather than speculation.
9. Risk Factors
Although the chart is improving, investors should continue monitoring:
- NASDAQ market trend & U.S. inflation data
- Federal Reserve policy decisions
- Earnings announcements & technology sector sentiment
- Institutional buying activity
A breakdown below the current support zone would weaken the bullish outlook.
10. Final Technical Opinion
Our technical assessment suggests that SPCX is entering an attractive accumulation zone. The correction appears to be slowing, buyers are gradually returning, and price action is beginning to stabilize.
While confirmation is still required, the current setup offers one of the most favorable technical risk-to-reward opportunities seen in recent weeks.
11. About the Research Analyst
Sahil Goyal is a Financial Market Analyst, Technical Analysis Mentor, and Market Educator with years of practical experience in equity, derivatives, and technical chart analysis.
His research emphasizes Price Action Analysis, Technical Analysis, Swing Trading, Market Psychology, Risk Management, and Portfolio Analysis to help traders make informed decisions through disciplined analysis.
12. Learn Technical Analysis with Technical Share Training Institute
If you want to learn how professional traders analyze charts, understand trends, and manage risk, join Technical Share Training Institute.
Practical Course Includes:
✔ Technical Analysis • ✔ Fundamental Analysis • ✔ Intraday Trading • ✔ Options Trading • ✔ Futures & Derivatives • ✔ Portfolio Management • ✔ Trading Psychology • ✔ Risk Management
Why Choose Us?
Practical Market-Based Learning • Online & Offline Classes • Established Since 2008 • Trusted by Thousands of Students • Live Market Analysis • Beginner to Advanced Training
Contact Us:
📞 Call / WhatsApp: +91-9013612668
🌐 Website: technicalsharetraining.com
📝 Research Reports & Market Insights: sahilgoyal.blog
📍 Google Business Profile (GMB): Open Google Location & Reviews